

Top 7 Metrics Every B2B Competitive Analysis Must Track
You already know who your competitors are. What you may not know is why they’re outperforming you, or how to beat them at it.
A solid B2B competitive analysis doesn’t only track surface-level moves. Things like a new blog post or a paid ad. It’s a structured, data-driven framework for uncovering how your competitors are positioning, performing, and scaling.
In industries like SaaS, manufacturing, and B2B services, the right metrics give you more than insight, they give you operational leverage. These are not vanity KPIs. They directly inform pricing, product development, sales enablement, and messaging strategies.
This article breaks down 7 high-impact metrics that sit at the core of modern competitive analysis in B2B. Metrics that your competitors are likely already tracking. If you’re not, you’re missing the clearest signals they’re putting into the market.
7 Metrics Every B2B Competitive Analysis Should Include
1. Market Share Delta
Static market share numbers don’t tell you who’s winning. Movement does. Watching who’s gaining share, and at what pace, is one of the clearest signals you can use to track momentum.
A competitor going from 3% to 6% market share in one year isn’t only growing. They’re doubling their footprint while you might be flat. That shift changes your positioning context whether you realize it or not.

Estimate Market Share Using Directional Data
Market share isn’t generally a precise number; it’s a moving target. But you can build a reliable estimate by triangulating multiple data points: revenue disclosures (publicly available financial data from earnings reports or funding rounds), traffic trends (changes in web visitors that signal brand growth or decline), hiring velocity (spikes or drops in job postings hinting at expansion or contraction), and customer announcements (public wins, partnerships, or losses).
This approach tracks consistency over time. When layered together, these signals form a directional trendline, offering a clearer picture of who’s gaining ground and who’s losing it. In B2B market intelligence, this ongoing trendline is far more valuable than a one-time snapshot, because real competitive shifts happen gradually, not in isolated moments.
Use Market Share Movement as a SWOT Input
company’s market share trajectory is an early warning system. For any SWOT analysis for B2B companies (Strengths, Weaknesses, Opportunities, Threats), live performance data is more insightful than post-mortem analysis of what went wrong after the fact.
Here’s the key signal: losing market share while competitor’s scale. Even if internal metrics look strong, such as: solid customer retention, healthy revenue, growing engagement; if competitors are pulling ahead, it points to a deeper strategic weakness. It’s not current performance; it’s relative momentum. If others are expanding faster, your competitive position is slipping.
For a deeper breakdown of SWOT execution, competitive benchmarking, and digital research frameworks, explore our Effective B2B Market Research Strategies in 2026.
2. Paid Search Intent Mapping: Where the Money Goes, Attention Follows
Most companies won’t tell you what product line or market they’re betting on. But their ad spend will.
In competitive analysis in B2B, paid search behavior acts as a tactical footprint. What a company chooses to spend money on, things like keywords, audiences, funnel stages; tells you what they care about most. It also tells you what they believe converts.
Analyze Funnel-Stage Targeting
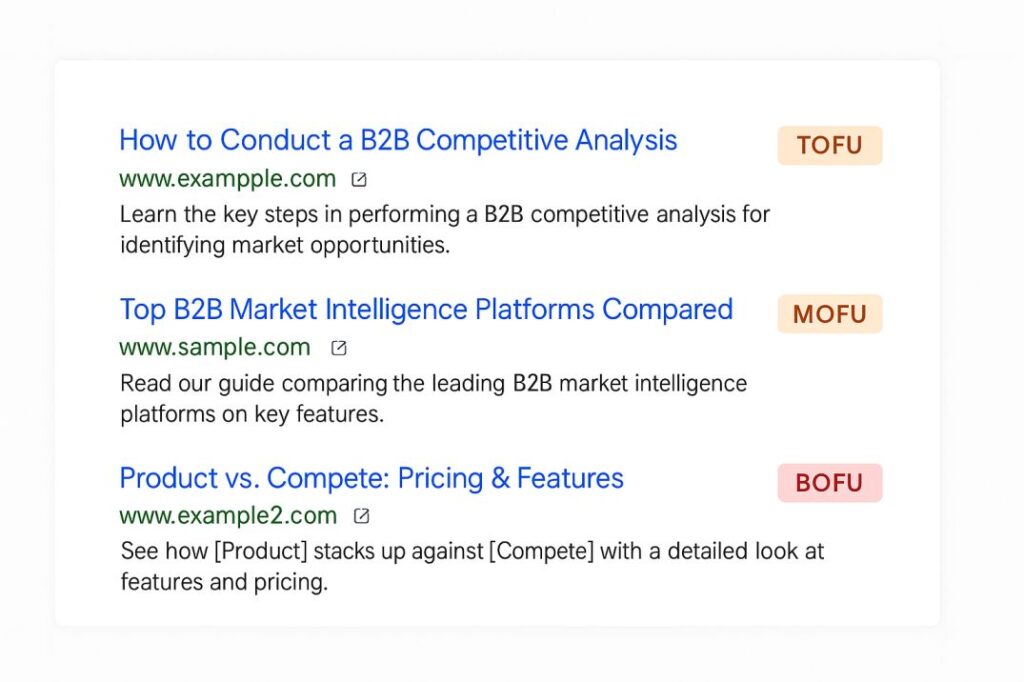
Not all PPC campaigns serve the same purpose. They align with different stages of the buyer’s journey. To understand how competitors structure their funnel, use tools to analyze whether they’re focusing on:
- TOFU (Top of Funnel) terms: broad, educational keywords aimed at awareness.
- MOFU (Middle of Funnel) terms: solution comparison queries targeting users evaluating options.
- BOFU (Bottom of Funnel) terms: direct conversion queries where buyers are ready to make a decision.
A competitor’s keyword focus reveals more than their SEO strategy. It signals their go-to-market urgency. Heavy investment in BOFU suggests they’re prioritizing immediate revenue over education, while a broader TOFU strategy implies they’re playing the long-term brand-building game. Understanding these choices gives you insight into how their funnel is structured and where they’re placing their bets.

Decode Messaging and Positioning Strategy
Ad copy acts as a window into competitive positioning. If a competitor consistently emphasizes phrases like “compliance automation” or “self-serve onboarding”, it’s not simply an SEO tactic. They’re carving out a distinct space in the market, shaping buyer perceptions in real time.
This level of messaging analysis is high-signal B2B competitor research. It reveals how they differentiate themselves and which pain points they prioritize. If a particular framing dominates their ads, it’s likely a core piece of their strategic narrative, influencing their broader positioning beyond PPC.
Evaluate Retargeting and Spend Structure
Ad strategy doesn’t stop at first impressions, what happens after that matters just as much. The presence of remarketing tags and multi-platform ad coverage (Google, LinkedIn, Twitter, etc.) is a direct indicator of funnel maturity. Competitors who heavily invest in retargeting are likely nurturing potential buyers over time. Ensuring repeated brand exposure before conversion.
If your competitors aren’t investing in retargeting, that’s a golden opportunity. Winning the second impression, the ad buyers see after they’ve visited a competitor’s site, is often the moment that shifts the deal. When structured correctly, remarketing doesn’t just follow potential customers; it steers the narrative and positions your brand as the better alternative.
3. Innovation Cadence: Who’s Building, Not Just Branding
B2B market intelligence is incomplete without tracking product evolution. Product updates, new feature launches, integrations, and patents all reflect how quickly and effectively a company adapts to market needs. A quarterly cadence of meaningful changes indicates not just engineering capability, but product-market awareness.
Monitor Product Releases and Feature Timelines
Product development tells you how fast a company adapts. Changelogs (logs of feature updates), public roadmaps (previews of planned improvements), and update announcements provide a real-time pulse on how aggressively a company is iterating.
Frequent updates signal more than just technical refinement. They show that a company is actively listening to market demands and adjusting ahead of the curve. In B2B, where long development cycles can slow momentum, companies that push frequent updates tend to operate outside the standard market cycle, responding faster than competitors who release fewer or sporadic enhancements.
Spot Strategic Shifts Through Ecosystem Plays
Sometimes, the biggest competitive moves happen through integrations and category expansion. When a company rolls out support for a newly relevant platform (like integrating with an emerging CRM or AI tool) or expands into adjacent market categories (such as adding features suited for mid-market after previously targeting enterprises), they’re not just improving usability, they’re positioning for a long-term strategic advantage.
A well-timed integration can turn a previously isolated product into a central workflow tool, while category expansion can signal deeper market ambitions that weren’t obvious before. Recognizing these early signs helps businesses prepare before the momentum becomes impossible to ignore.

Use Innovation Velocity in SWOT Assessment
A stagnant roadmap is a silent killer in B2B. It’s easy for a company to appear stable while competitors quietly outpace them. That’s why innovation velocity, the speed at which a company launches new features and improvements, serves as a critical benchmark in a SWOT analysis for B2B companies.
Internally, a steady product roadmap may feel like stability. But externally, slow-moving updates can signal lack of relevance. The reality is simple: in any competitive situation, you’re either pushing the pace or watching someone else do it.
4. Organic Visibility in the Buyer Journey
Most B2B teams track keywords. Few track buyer-stage visibility.
In a proper B2B competitive analysis, knowing who ranks for what is only the start. The more strategic question is: where in the journey are competitors dominating visibility? Because showing up when a buyer starts researching a solution matters more than winning traffic from branded queries.
Segment Competitor Rankings by Funnel Stage
Use SEO tools to map where your competitors rank across awareness, consideration, and decision-stage queries. If they own BOFU search terms like “[product] vs [product],” they’re controlling the endgame. If they dominate TOFU queries, they’re framing the conversation from the start.
Identify Content Structures That Convert
Are their top-ranking pages product pages, comparison guides, use case explainers, or blog articles? Their content formats show you what’s working, not just what’s published. This is where B2B competitor research meets actionable content modeling.
Close Funnel Gaps With Intent-Based Content
When you spot high-intent keywords where competitors dominate and you’re absent, that’s not a ranking gap, it’s a pipeline gap. Use that insight to drive content strategy that doesn’t only rank, but converts across the buyer lifecycle.
5. Technical & UX Readiness Score
In complex B2B buying cycles, technical performance issue is a deal breaker.
A slow, buggy, or inaccessible website silently erodes trust. When you evaluate competitors through a full B2B competitive analysis, it’s critical to look at not just what they say, but how fast and well they deliver it. Because in B2B, buyers don’t stick around to wait for answers. They move on.
Benchmark Core Web Vitals and Page Experience
Use Lighthouse, PageSpeed Insights, or other audit tools to evaluate competitors’ load times, interactivity, and mobile responsiveness. If they score consistently higher across performance metrics, they’re more discoverable and smoother to buy from.
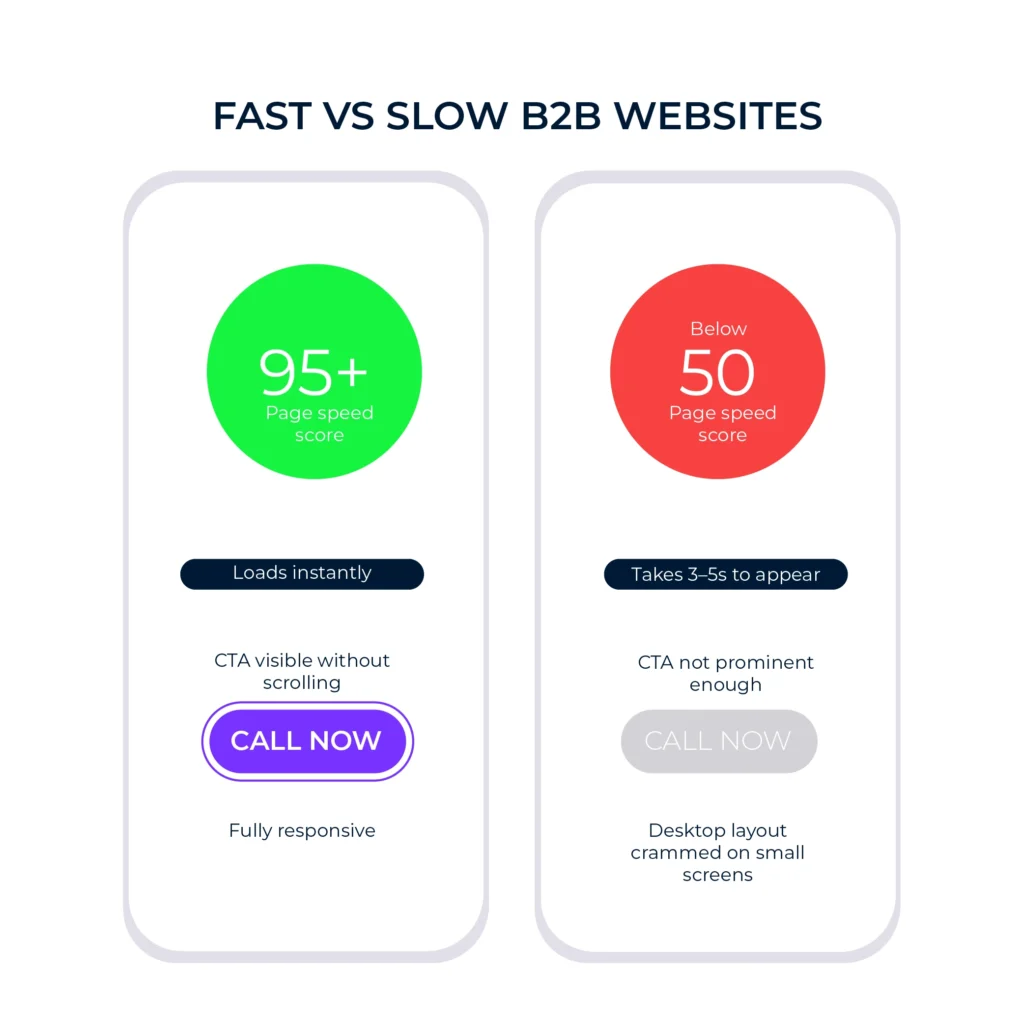
Track UX Friction Points Across the Funnel
Beyond speed, look at structure. Are CTAs clear? Is the navigation seamless? Are demo forms mobile-friendly? These small elements often decide whether a lead converts or bounces. Competitors who streamline the UX are reducing drop-off at every touchpoint.
Turn UX Insights Into Conversion Strategy
This is where competitive analysis in B2B reveals tactical advantage. If your competitors are underperforming on UX, that’s a gap to exploit. If they’re ahead, you now know where your site may be silently bleeding revenue.
6. Pricing Positioning & Model Transparency
Pricing is positioning in disguise. In competitive analysis in B2B, understanding how your competitors price (and how transparently they do it) gives you insight into their target customer, deal velocity, and margin strategy. It also helps you reverse-engineer how they want to be perceived: premium, disruptive, or flexible.
Analyze Pricing Models and Tiers
Whether a company opts for flat-rate pricing, usage-based models, tiered packages, or custom quotes, each decision reflects strategic intent.
Freemium models or free trials typically indicate land-and-expand strategies. Here companies prioritize onboarding a wide user base, expecting conversion to paid plans over time. In contrast, high-entry pricing, where there’s no free tier, suggests a focus on enterprise clients or limited Total Addressable Market (TAM). Meaning the company is targeting a smaller, high-value customer base rather than mass adoption.
Look for Gaps in Transparency
Pricing transparency equals buyer trust. Companies that hide pricing behind demo requests or vague “Contact Sales” calls-to-action are often doing so for one of two reasons:
- Complex pricing models: their offerings may be highly customized, making it hard to present a standard price.
- Commoditization concerns: they don’t want direct price comparisons with competitors.
For buyers, clear pricing removes friction, making self-service purchases easier. If competitors aren’t transparent, there’s an opportunity to win over comparison shoppers by offering direct and accessible pricing.
To see how these metrics align with emerging market research innovations, like AI-driven segmentation and real-time behavioral tracking, read our Top Market Research Trends for 2026.
7. Brand Share of Voice
You can have a better product and still lose the deal. This is because buyers believe what they hear more than what you say.
Brand share of voice captures which companies are showing up across organic channels, LinkedIn feeds, community posts, newsletters, and analyst briefings. In modern competitive analysis in B2B, attention equals positioning power.
Measure Engagement, Not Just Output
Posting weekly means little if no one engages. Track comments, shares, thought leadership traction, and brand mentions. The companies that shape buyer conversations are cited, not only published.
Map Owned vs Earned Attention
Are competitors relying on paid visibility, or are they earning brand presence through expert commentary, partnerships, or analyst inclusion? Share of voice that’s earned, not bought, has longer shelf life and higher trust impact.
Use Positioning Gaps to Your Advantage
If competitors dominate product conversations but are weak in category leadership, that’s your opening. Reverse engineer their messaging patterns, plug into conversations they’re missing, and build credibility in white space they’ve ignored.
This kind of B2B competitor research is about perception. In crowded B2B markets, perception often shapes outcomes more than capabilities.
Conclusion:
A modern B2B competitive analysis is not a quarterly deck anymore. It’s a strategic system, a continuous layer of awareness that sharpens how you build, sell, and position.
These seven metrics do more than describe competitors. They expose momentum, missteps, and leverage points across your market. When you use them consistently, they feed into your SWOT analysis, inform your next product sprint, and give you a sharper lens into evolving buyer expectations. And most importantly, they keep you from competing blind.